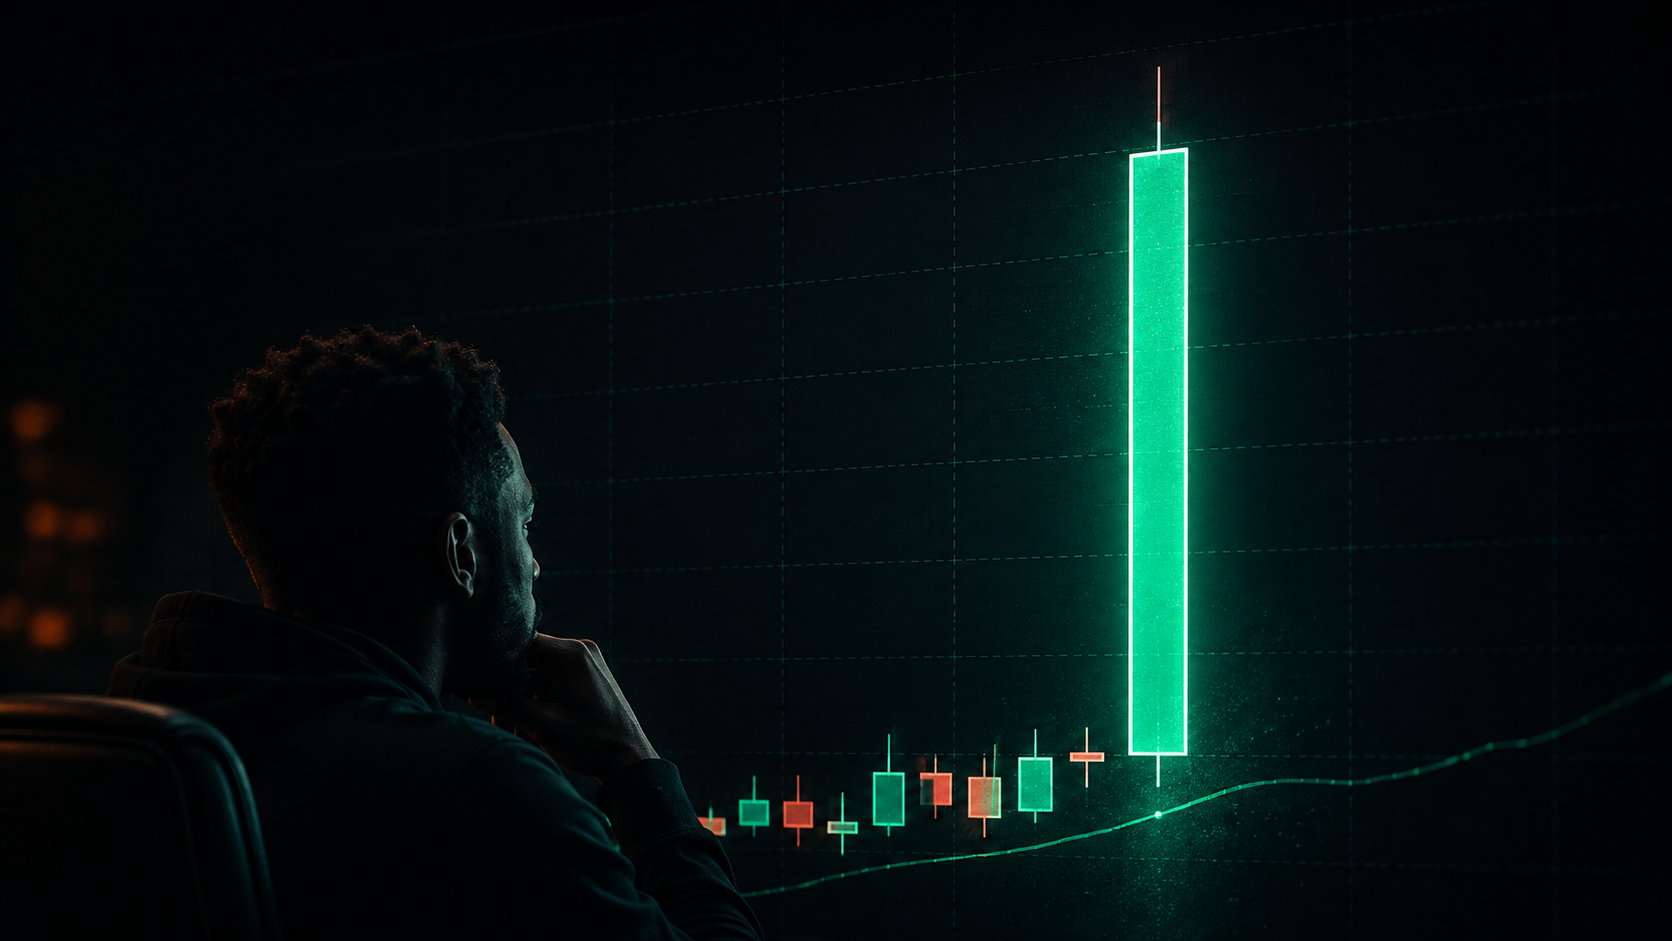
The Salience Trap: Why One Giant Bitcoin Candle Feels Like Certainty
A single, dominant price candle can disproportionately capture attention and influence perception in financial markets.
AI Generated • IM7 Intelligence
- Reading time
- 10 min read
- Word count
- 2,056 words
- Published
A recent Bitcoin candle surged from below $70,000 to above $71,000 and visually dominated the surrounding chart. Large moves like this can become psychologically dominant, increasing salience, urgency, and the temptation to mistake visual magnitude for confirmation.
- #attentional capture
- #behavioral finance
- #bitcoin
- #bitcoin trading
- #certainty effect
- #cognitive bias
- #confirmation
- #decision making
- #IM7 Intelligence
- #market behavior
- #market psychology
- #price action
- #risk management
- #salience bias
- #trader mistakes
- #trader psychology
- #trading discipline
- #trading psychology
- #uncertainty
- #visual salience
On this page
- Executive Summary
- IM7 Principle #047 — The Salience Trap
- Market Context
- Observed from the chart
- Not observable from the chart alone
- What the Candle Can Make You Want to Believe
- Behavioral Observation
- Behavioral Chart 01 — Salience vs. Confirmation
- Chart Concept
- **Certainty Gap**
- IM7 Read
- Key takeaway
- Chart Disclaimer
- Cognitive Bias Breakdown
- Salience is not the same as overconfidence
- Behavioral Model 01 — The Salience-to-Certainty Sequence
- Model
- Interrupt Question
- IM7 Read
- Model Disclaimer
- The Professional Read
- 1. What happened?
- 2. What might it mean?
- 3. What evidence would distinguish between them?
- The Observation–Interpretation Split
- Observation
- Interpretation
- Decision Framework
- 1. Isolate the Observation
- 2. Measure Your Reaction to the Size
- 3. Identify the Story You Immediately Created
- 4. Define Confirmation Before Seeking It
- 5. Consider Competing Interpretations
- 6. Recheck the Original Process
- Risk Management Lesson
- What This Candle Does Not Tell Us
- IM7 Quote
- IM7 Observation
- IM7 Decision Rule
Executive Summary
Bitcoin recently produced an unusually large 2-hour expansion candle, moving from roughly the $69,800 area toward $71,800 and visually dwarfing the price action immediately preceding it.
That observation is straightforward.
What the candle means is not.
Large, visually dominant market events can capture attention so aggressively that magnitude begins to feel like confirmation. The latest move becomes easier to see, easier to remember, and easier to build a narrative around than the quieter structure that preceded it.
This report examines that distinction through the lens of salience and attentional capture.
The behavioral risk is not that traders notice a large candle. They should.
The risk begins when:
visual prominence → perceived importance → emotional urgency → premature certainty
The candle became larger.
That does not mean the evidence became proportionally stronger.
The central decision problem is therefore simple:
How do you separate a market event that deserves attention from a market event that deserves increased conviction?
IM7 Principle #047 — The Salience Trap
What captures the most attention does not necessarily contain the most information.
Visually prominent market events can disproportionately influence judgment because they become psychologically dominant.
A large candle may deserve analysis because it represents rapid price expansion.
But its size alone does not establish:
- continuation,
- reversal,
- breakout durability,
- participant motivation,
- or future direction.
Salience increases attention. It does not automatically increase certainty.
Market Context
Bitcoin's recent 2-hour structure included relatively compressed candles around the upper-$69,000 region followed by a sudden expansion toward approximately $71,800.
The expansion candle was dramatically larger than the preceding bars visible on the chart.
At the time of observation, the candle was still forming.
Price had moved away from the intrabar high, leaving an upper wick, but that wick should not yet be treated as confirmed rejection or evidence of reversal.
Observed from the chart
- Bitcoin traded from approximately the $69,800 region toward $71,800.
- The expansion candle was substantially larger than nearby preceding candles.
- The move occurred within a single 2-hour candle.
- Price traded below the intrabar high while the candle was still open.
- The latest candle visually dominated the surrounding chart.
Not observable from the chart alone
The chart does not establish:
- how many traders experienced FOMO,
- whether participants became overconfident,
- whether shorts were covering,
- whether new buyers were chasing,
- whether the move was news-driven,
- whether liquidity conditions caused the expansion,
- or whether price will continue or reverse.
Those are possible explanations or behavioral hypotheses.
They are not chart observations.
This distinction matters because the more visually dramatic the event becomes, the easier it is to move from observation to explanation without noticing the transition.
What the Candle Can Make You Want to Believe
A candle of this magnitude can invite a powerful interpretation:
"This changes everything. The market has made its decision."
Notice the wording.
The chart itself did not say that.
The observer supplied the conclusion.
The move may ultimately prove important. It may even become part of a sustained trend.
But those outcomes cannot be known from size alone.
The behavioral danger is that rapid expansion compresses the time between seeing new information and constructing meaning around it.
The trader moves quickly from:
"Bitcoin moved sharply."
to:
"This move confirms my interpretation."
Those are different statements.
The first is an observation.
The second is a judgment.
Behavioral Observation
The same candle can support several psychologically compelling narratives depending on the observer's previous position.
A trader who remained long might think:
"I knew it."
A trader who recently exited might think:
"I sold too early."
A trader sitting in cash might think:
"I have to get in."
A bearish trader might think:
"This has to be exhaustion."
The price event is the same.
The narratives are not.
That distinction reveals the deeper behavioral problem.
Markets provide observations.
Observers manufacture meaning from those observations using:
- prior positioning,
- expectations,
- regret,
- confidence,
- recent experience,
- and existing narratives.
A visually dominant candle can accelerate that process because it becomes disproportionately difficult to ignore.
The event does not need to tell everyone the same story.
It only needs to become psychologically important enough that everyone feels compelled to tell themselves a story.
Behavioral Chart 01 — Salience vs. Confirmation
Chart Concept
Title: Salience vs. Confirmation
X-axis: Visual / Emotional Salience
Y-axis: Verified Evidence
The conceptual chart should show two lines:
Attention / Perceived Importance
- rises sharply when a dramatic market event appears.
Verified Confirmation
- rises more slowly and depends on subsequent evidence.
The space between those two lines represents the:
**Certainty Gap**
The Certainty Gap is the period in which a market event feels highly meaningful before enough subsequent evidence exists to justify an equivalent increase in conviction.
IM7 Read
The more dramatic the event, the wider the gap can become between:
what feels important
and
what has actually been confirmed.
Key takeaway
Visual magnitude can change faster than evidentiary quality.
Chart Disclaimer
This is an IM7 conceptual behavioral framework using illustrative relationships rather than measured trader-sentiment data. It does not estimate probabilities or predict future Bitcoin direction.
Cognitive Bias Breakdown
The primary behavioral mechanism here is salience-driven attentional capture.
Highly noticeable information tends to receive disproportionate cognitive weight because it is easier to notice, recall, and incorporate into judgment.
Tversky and Kahneman's work on judgment under uncertainty demonstrated more broadly how information that is cognitively accessible can receive disproportionate influence in decision-making Tversky & Kahneman, 1974.
In this market context, the important sequence is:
large visual event → captured attention → elevated perceived importance → narrative construction
This does not mean that every large candle is misleading.
It means the size of the candle and the quality of the conclusion drawn from it are separate variables.
A second mechanism may involve recency.
The newest event can dominate interpretation precisely because it is the most immediate information available.
Three weeks of slower structure can become psychologically compressed by one dramatic candle.
The prior structure has not disappeared.
But perceptually, it can begin to feel less important.
Salience is not the same as overconfidence
Overconfidence may appear later.
For example:
"I knew this breakout was coming."
But overconfidence is not required for the original distortion.
The first problem occurs earlier:
attention became concentrated before the evidence became conclusive.
Behavioral Model 01 — The Salience-to-Certainty Sequence
Model
1. Quiet Structure Price develops through relatively smaller, less visually dominant movements.
↓
2. Salient Event A dramatically larger candle captures attention.
↓
3. Attentional Compression Previous structure becomes psychologically less prominent.
↓
4. Narrative Construction The observer rapidly assigns meaning: "breakout," "exhaustion," "confirmation," "missed opportunity."
↓
5. Urgency Rises The desire to act increases before interpretation has been fully tested.
↓
6. Perceived Certainty Expands The strength of the feeling begins to exceed the strength of the evidence.
↓
7. Decision Risk Position size, entry standards, exits, or conviction may change before sufficient follow-through exists.
Interrupt Question
"If this candle were half the size, would I interpret the setup the same way?"
If the answer changes dramatically, salience may be influencing the judgment.
IM7 Read
The candle did not necessarily change the trader's process.
It may have changed the trader's urgency to abandon that process.
Model Disclaimer
This model is an IM7 conceptual framework describing a possible behavioral sequence. It does not claim that all traders respond this way or that a large candle predicts continuation or reversal.
The Professional Read
A disciplined market operator separates three questions.
1. What happened?
Bitcoin experienced rapid price expansion within a 2-hour candle.
That is observable.
2. What might it mean?
The move could eventually represent:
- continuation,
- breakout acceptance,
- short-term dislocation,
- exhaustion,
- event-driven repricing,
- or another market process.
Those are hypotheses.
3. What evidence would distinguish between them?
That requires additional information.
Potential evidence may include:
- subsequent price behavior,
- acceptance or rejection around newly tested levels,
- retests,
- additional candles,
- independently verified volume data,
- relevant market-wide data,
- or external catalysts when applicable.
The professional does not ignore the large candle.
They prevent its visual intensity from doing analytical work that subsequent evidence has not yet done.
That distinction is critical.
The large candle is an event that generated new information.
It is not automatically an event that resolved uncertainty.
The Observation–Interpretation Split
A useful behavioral discipline is to describe the chart twice.
Observation
"Bitcoin expanded from roughly $69,800 toward $71,800 within a large 2-hour candle."
Now describe the interpretation separately.
Interpretation
"This may represent a meaningful expansion from the prior structure."
The word may matters.
Compare that with:
"Bitcoin confirmed the next leg higher."
That final statement contains information the candle itself cannot yet establish.
The professional objective is not to eliminate interpretation.
Markets require interpretation.
The objective is to recognize precisely when observation ends and interpretation begins.
Decision Framework
1. Isolate the Observation
Describe only what can be seen or independently verified.
Example:
"A substantially larger 2-hour candle expanded from approximately $69,800 toward $71,800."
Avoid beginning with:
"Bitcoin confirmed a major breakout."
That is already interpretation.
2. Measure Your Reaction to the Size
Ask:
"Would I interpret this structure differently if the exact same price information had developed across four smaller candles?"
If yes, visual magnitude may be affecting judgment independently of market structure.
3. Identify the Story You Immediately Created
Did your mind jump toward:
- "I knew it,"
- "I missed it,"
- "I need to buy,"
- "the move is over,"
- "this confirms everything"?
Write the story down.
Then separate the story from the observation.
4. Define Confirmation Before Seeking It
Do not decide what counts as confirmation after seeing the next candle.
Determine beforehand what evidence would materially strengthen or weaken the thesis.
This reduces narrative flexibility.
5. Consider Competing Interpretations
Construct at least two plausible explanations that contradict your preferred narrative.
Not because all interpretations are equally likely.
Because forcing alternatives prevents one visually dramatic event from becoming the entire analytical framework.
6. Recheck the Original Process
Ask:
"Did the setup improve, or did my urgency increase?"
That single distinction can prevent a large candle from rewriting entry standards in real time.
Risk Management Lesson
Salience becomes financially relevant when it changes behavior.
A dramatic candle can create pressure to:
- increase position size,
- loosen entry criteria,
- chase price,
- abandon a stop,
- exit prematurely,
- cover defensively,
- or reinterpret an existing thesis.
The risk is not simply emotional excitement.
The risk is process modification under attentional pressure.
If a trader planned to wait for a retest before the candle appeared, the candle's size alone should not automatically invalidate that process.
If the plan changes, the trader should be able to identify the new evidence that justified changing it.
Otherwise:
the information may not have changed enough to justify the decision.
Only the emotional urgency did.
What This Candle Does Not Tell Us
The expansion candle does not tell us with certainty:
- whether Bitcoin will continue higher,
- whether the move will retrace,
- whether the upper wick will become significant,
- whether buyers or short covering dominated the move,
- whether participants broadly became euphoric,
- or whether the move represents a durable structural shift.
A behavioral article should not resolve those questions merely because the chart looks dramatic.
That restraint is part of the analysis.
IM7 Quote
"The biggest candle on your screen can be the hardest one to read clearly."
"Size creates attention. Not certainty."
IM7 Observation
Live market reading becomes most difficult when price intensity and psychological intensity rise together.
A visually dominant move can become psychologically dominant before its meaning has been established.
That does not make the move irrelevant.
It makes disciplined interpretation more important.
The trader's job is not to suppress attention.
The candle deserves attention.
The trader's job is to prevent attention from quietly becoming conviction.
The candle got bigger.
So might the trader's certainty.
But only one of those changes is directly visible on the chart.
IM7 Decision Rule
Never let visual magnitude substitute for confirmation.
A large candle tells you that price moved rapidly.
It does not, by itself, tell you why the move occurred, whether it will persist, or whether your preferred interpretation is correct.
When the market becomes visually louder, increase analytical discipline before increasing conviction.
Size creates attention. Evidence earns certainty.
How did this land?
What emotion or bias did this article help you recognize?
- #attentional capture
- #behavioral finance
- #bitcoin
- #bitcoin trading
- #certainty effect
- #cognitive bias
- #confirmation
- #decision making
- #IM7 Intelligence
- #market behavior
- #market psychology
- #price action
- #risk management
- #salience bias
- #trader mistakes
- #trader psychology
- #trading discipline
- #trading psychology
- #uncertainty
- #visual salience
References
- [1]Tversky, A., & Kahneman, D. (1974). Judgment under Uncertainty: Heuristics and Biases. Science. American Association for the Advancement of Science. DOI: 10.1126/science.185.4157.1124.
- [2]Taylor, S. E., & Thompson, S. C. (1982). Stalking the Elusive “Vividness” Effect..
- [3]
Pass the signal forward.
IM7 Intelligence studies financial markets through the lens of psychology rather than prediction. Our research focuses on behavioral finance, crowd psychology, sentiment, and decision-making to help readers understand why markets move—not just where they move.
IM7 Intelligence publishes educational research on market psychology, behavioral finance, and investor behavior. Nothing published by IM7 Intelligence constitutes financial, investment, tax, or legal advice. Always conduct your own research before making financial decisions.
Read the market's emotion before it acts.
Where this article sits in the map.
- Confirmation BiasYou are here
- Behavioral Finance
- Risk Management
- Fear
Curated paths, not random articles.
Behavior read in real time.

Ismael Mercius
Ismael Mercius is the founder of IM7 Intelligence, where he writes about crypto market psychology, behavioral finance, and the sentiment cycles that drive digital asset prices. His work focuses on how traders actually make decisions — and the recurring errors that show up in their P&L.
- Crypto market psychology
- Behavioral finance
- Market sentiment analysis
- Trader behavior & decision-making