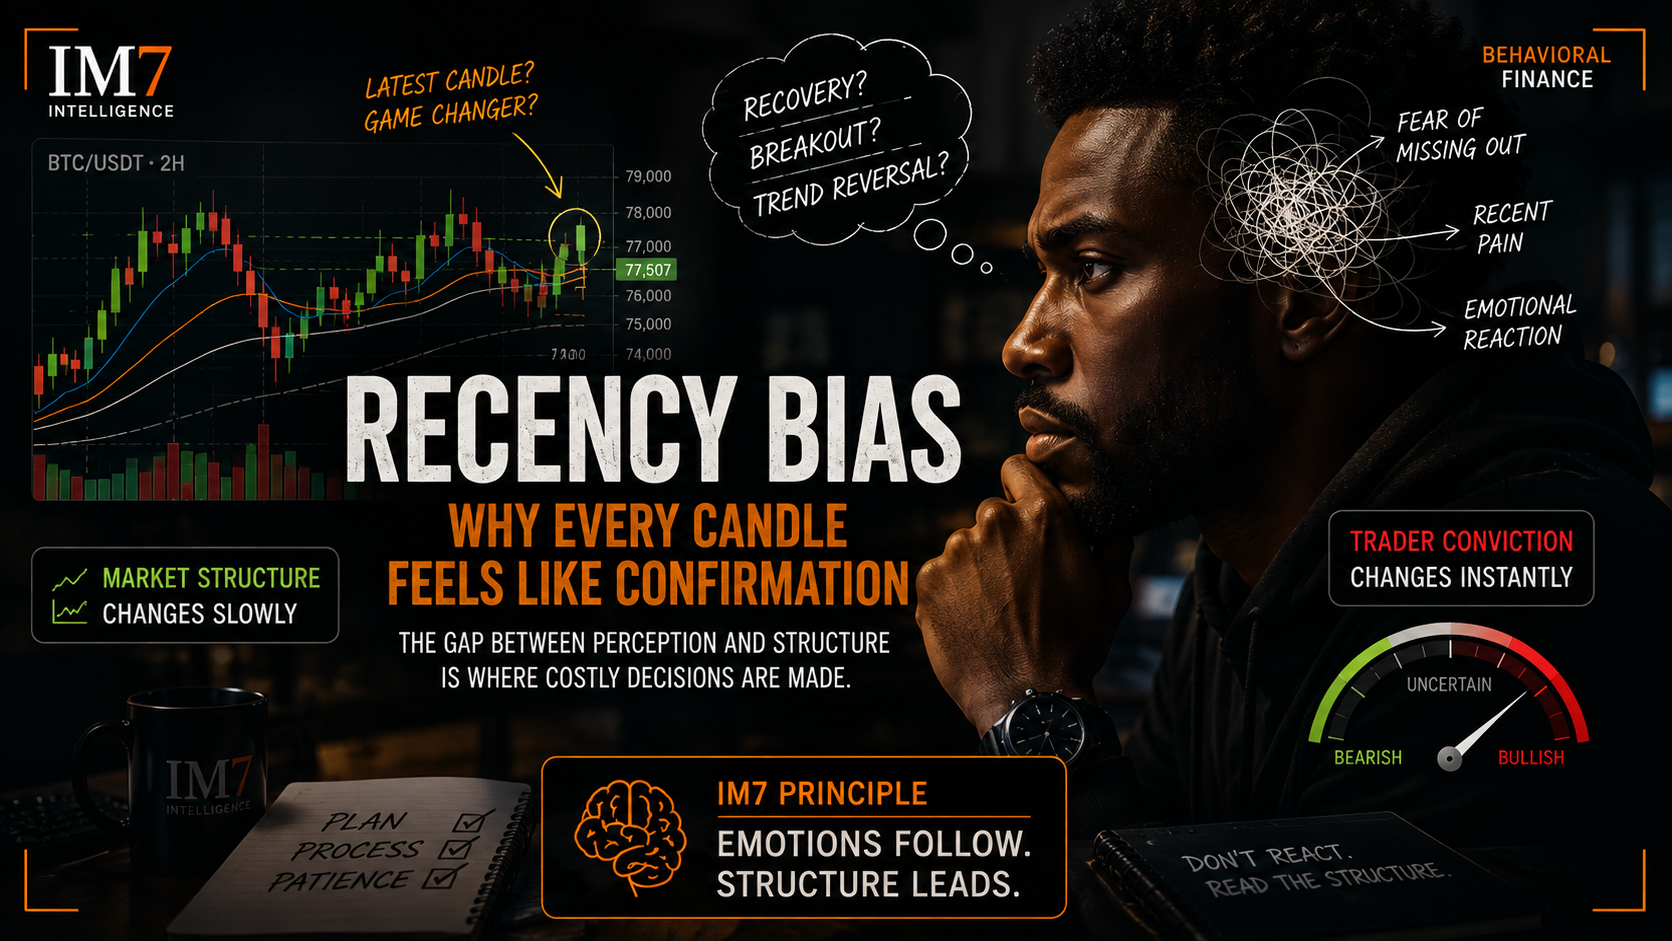
The Recency Trap: When Every Bitcoin Candle Feels Like Confirmation
AI Generated • IM7 Intelligence
- Reading time
- 17 min read
- Word count
- 3,478 words
- Published
Bitcoin’s volatile swings are making every new candle feel like confirmation. But when a trader’s conviction changes faster than the market structure, recency bias may be driving the interpretation.
On this page
- Executive Summary
- IM7 Principle #051 — The Recency Trap
- Chart Concept
- Line 1 — Structural Information
- Line 2 — Perceived Certainty
- IM7 Read
- Key Takeaway
- Disclaimer
- Chart Concept
- Line 1 — Market Structure
- Line 2 — Trader Conviction
- The Recency Gap
- IM7 Read
- Key Takeaway
- Disclaimer
- 1. Uncertainty Exists
- 2. Large Candle Appears
- 3. Emotional Interpretation Strengthens
- 4. Certainty Increases
- 5. Opposite Candle Appears
- 6. Previous Certainty Collapses
- 7. New Narrative Forms
- 8. Another Candle Appears
- IM7 Read
- Chart Concept
- Line 1 — Price Volatility
- Line 2 — Interpretation Stability
- Behavioral Stress Zone
- IM7 Read
- Key Takeaway
- Disclaimer
- Stage 1 — Candle
- Stage 2 — Attention
- Stage 3 — Interpretation
- Stage 4 — Emotion
- Stage 5 — Conviction
- Stage 6 — Action Pressure
- Stage 7 — New Candle
- Interrupt Question
- Structural Update
- Primary Question
- Attention
- Trigger
- Time Horizon
- Emotional Pressure
- Response
- Goal
- Reactive Update
- Primary Question
- Attention
- Trigger
- Time Horizon
- Emotional Pressure
- Response
- Goal
- Recency Dominance
- Primary Question
- Attention
- Trigger
- Time Horizon
- Emotional Pressure
- Response
- Goal
- Diagnostic Question
- 1. What happened?
- 2. What has materially changed?
- 3. How much did my conviction change relative to the evidence?
- 1. Identify the Previous Thesis
- 2. Identify What Actually Changed
- 3. Separate Candle Size From Information Quality
- 4. Check for Confirmation Stacking
- 5. Compare Conviction Before and After
- 6. Expand the Time Horizon
- 7. Define What Would Actually Confirm the Thesis
Executive Summary
Bitcoin did not suddenly become easier to read.
The trader's interpretation simply became easier to change.
After expanding toward approximately $78,750, Bitcoin subsequently gave back more than $2,000 before recovering from the broader $76,600 area.
On the current 2-hour chart, price is trading near $77,507, above a 9-period EMA near $77,263.
The visible sequence contains large green candles, large red candles, long wicks, failed continuation attempts, and another developing recovery.
That environment creates a specific behavioral problem.
Each new candle can feel as though it resolves the uncertainty created by the previous one.
Green:
"The recovery is back."
Red:
"The decline has resumed."
Green again:
"This one confirms it."
The market may have produced new information.
But new information and decisive information are not the same thing.
The behavioral danger emerges when the most recent candle receives more authority than the broader structure deserves.
That is the Recency Trap.
The central lesson is:
When conviction changes faster than market structure, the trader should examine the conviction before changing the thesis.
IM7 Principle #051 — The Recency Trap
The newest market information often feels like the most important information precisely because it is the easiest information to remember and emotionally experience.
Recency bias gives disproportionate influence to what happened most recently.
In a quiet market, that distortion may remain small.
In a volatile market, it can become extreme.
Every large candle arrives with enough visual and emotional force to overwrite the interpretation created by the candle before it.
The trader is therefore exposed to two forms of volatility:
Price volatility
and
interpretation volatility.
The first belongs to the market.
The second belongs to the observer.
The distinction matters.
Bitcoin recently expanded toward approximately $78,750 before experiencing a sharp retracement of more than $2,000.
On the current 2-hour chart, observable features include:
- a significant decline from the recent high,
- several large alternating candles,
- a reaction from the broader $76,600 region,
- a subsequent recovery,
- price near $77,507,
- and the 9 EMA near $77,263.
The current price is therefore trading above the short-term average visible on the chart.
These observations tell us what happened.
They do not, by themselves, prove:
- that the recent low is confirmed,
- that the larger decline has finished,
- that the bullish trend has fully resumed,
- that another selloff must occur,
- that $76,600 will continue functioning as support,
- or what Bitcoin will do next.
That distinction is essential.
The behavioral question is not:
"Is the current green candle bullish?"
The more useful question is:
"How much should this candle change my interpretation of the entire structure?"
Those are different problems.
The strongest psychological pressure did not begin with the current green candle.
It began with the sequence that came before it.
Bitcoin first produced substantial upside expansion.
That expansion rewarded bullish expectations.
Then price reversed sharply.
The reversal punished certainty.
Then price bounced.
Relief returned.
That sequence forces traders through repeated emotional transitions:
confidence → concern → relief → doubt → renewed confidence.
Every transition makes the next candle feel more consequential because the trader wants the uncertainty to end.
That creates the conditions for recency bias.
The newest candle is no longer merely another observation.
It begins functioning as a psychological answer.
Recency bias is the tendency to overweight recently encountered information when forming judgments.
In trading, this can cause the latest price action to dominate evidence that developed across a much longer period.
The trader may think:
"Look at that green candle."
Then:
"Look at that red candle."
Then:
"Look at this bounce."
Each observation may be valid.
The distortion appears when each new observation replaces rather than updates the previous analysis.
There is a crucial difference between:
Updating a thesis
and
resetting a thesis.
An update asks:
"What has changed relative to the structure I was already evaluating?"
A reset asks:
"What does the latest candle make me believe now?"
That second process can make conviction swing much faster than the evidence itself.
Chart Concept
Title: Latest Candle vs. Perceived Certainty
X-axis: Sequence of Recent Candles
Y-axis: Relative Trader Certainty
Use two conceptual lines.
Line 1 — Structural Information
Structural information should change more gradually.
It reflects evidence such as:
- meaningful level breaks,
- sustained acceptance or rejection,
- trend structure,
- volatility regime,
- invalidation,
- and continuation.
Its movement should be relatively measured.
Line 2 — Perceived Certainty
Perceived certainty oscillates much more aggressively.
Large green candle:
certainty rises sharply.
Large red candle:
certainty collapses.
Another green candle:
certainty rises again.
The visual gap between these two lines represents the Recency Trap.
IM7 Read
The market structure may change incrementally while the trader's confidence changes violently.
That mismatch creates reactive decisions.
Key Takeaway
A large change in emotion does not automatically represent a large change in evidence.
Disclaimer
This is an IM7 conceptual behavioral chart. Perceived certainty is illustrative and is not measured trader sentiment, an empirical probability, or a market forecast.
Large candles carry visual authority.
A small candle often feels inconclusive.
A large candle feels intentional.
It can appear to communicate:
- urgency,
- conviction,
- momentum,
- participation,
- and directional control.
The problem is not that those interpretations are always wrong.
The problem is that candle size can create psychological certainty faster than structural certainty actually develops.
Consider the strong upside candle visible before the subsequent large red reversal.
The expansion toward approximately $77,800 could easily produce the internal response:
"There it is."
"The recovery is real."
"Now I have confirmation."
Then the following bearish candle changes the emotional interpretation almost immediately.
The trader who felt certainty now feels doubt.
The chart has not merely moved.
It has altered the trader's confidence twice in very little time.
That is exactly the environment in which recency bias becomes expensive.
The current green candle creates another decision-pressure point.
Price has recovered from the recent lower region and is trading around $77,507, above the 9 EMA near $77,263.
That can feel constructive.
But the behavioral question is not whether the bounce exists.
It does.
The question is:
Does this bounce materially improve the broader thesis, or does it primarily make the trader feel better about the thesis?
Those are not equivalent.
A bounce can improve market structure.
A bounce can also improve mood.
A short-term EMA reclaim can represent useful technical information.
It can also become additional evidence collected by someone already looking for recovery.
The process must distinguish between those possibilities.
This is where recency bias can combine with confirmation bias.
A trader sees:
- a bounce,
- a green candle,
- price above the 9 EMA,
- and a reaction from a previously watched area.
Psychologically, that can feel like four separate confirmations.
But they may all be expressions of the same underlying event:
short-term price recovery.
When several observations derive from one underlying move, counting them as completely independent evidence can create artificial confidence.
That is confirmation stacking.
The trader believes evidence is accumulating.
In reality, the same price event may simply be appearing in several forms.
Chart Concept
Title: Market Structure vs. Trader Conviction
X-axis: Progression Through the Volatile Sequence
Y-axis: Relative Change
Use two conceptual lines.
Line 1 — Market Structure
Structure adjusts when meaningful evidence develops.
Examples:
- level acceptance,
- level rejection,
- sustained continuation,
- failure,
- invalidation,
- or a genuine structural break.
The line should move relatively slowly.
Line 2 — Trader Conviction
Conviction changes dramatically with individual candles.
Strong green:
bullish conviction spikes.
Strong red:
bullish conviction falls and bearish conviction rises.
Next bounce:
bullish conviction returns.
The Recency Gap
Highlight the areas where conviction changes substantially while structure changes very little.
Label this:
Recency Gap
IM7 Read
The larger the Recency Gap, the greater the chance that the trader is responding to emotional salience instead of structural change.
Key Takeaway
Conviction should not have a lower threshold for changing than the thesis itself.
Disclaimer
This is a conceptual behavioral framework. It does not represent measured market sentiment or predict directional price outcomes.
In volatile conditions, the internal dialogue often looks like this:
Before the green candle:
"I need confirmation."
After the green candle:
"This is confirmation."
After the red candle:
"The bounce failed."
After another green candle:
"This one looks different."
The trader feels as though each conclusion came from fresh analysis.
But sometimes the analytical framework did not change.
Only the most recent stimulus changed.
That is recency dominance.
The latest candle becomes the strongest evidence because it is:
- newest,
- most vivid,
- most emotionally available,
- and easiest to remember.
The trader becomes confident.
Then uncertain.
Then confident again.
The chart is volatile.
Eventually the trader becomes even more volatile than the chart.
1. Uncertainty Exists
The market structure is unresolved.
The trader wants greater clarity.
↓
2. Large Candle Appears
A strong directional candle enters the chart.
↓
3. Emotional Interpretation Strengthens
The trader thinks:
"Now I understand what is happening."
↓
4. Certainty Increases
Confidence becomes stronger than the structural evidence may justify.
↓
5. Opposite Candle Appears
Price moves sharply in the other direction.
↓
6. Previous Certainty Collapses
The trader thinks:
"I was wrong."
or:
"The market changed."
↓
7. New Narrative Forms
The latest candle becomes the new explanation.
↓
8. Another Candle Appears
The process begins again.
IM7 Read
The problem is not updating.
Updating is necessary.
The problem is allowing each candle to reset the entire interpretation without requiring meaningful structural change.
Recency bias becomes more dangerous when traders are tired.
After enough reversals, traders begin searching for psychological closure.
Initially the question is:
"Is this a high-quality decision?"
After repeated whipsaws, the question quietly changes:
"Is this finally the candle that tells me what is happening?"
That shift matters.
The goal is no longer purely analytical.
The trader wants relief.
Uncertainty is uncomfortable.
A large candle temporarily removes that discomfort.
That makes the candle psychologically valuable even when its informational value remains uncertain.
The trader is therefore vulnerable to treating relief as evidence.
Chart Concept
Title: Volatility vs. Interpretation Stability
X-axis: Increasing Market Volatility
Y-axis: Relative Stability
Use two conceptual lines.
Line 1 — Price Volatility
As volatility increases, candle size and directional swings expand.
This line rises.
Line 2 — Interpretation Stability
A disciplined process should remain comparatively stable.
However, under recency pressure, interpretation stability falls as volatility increases.
Behavioral Stress Zone
Highlight the region where:
market volatility is high
while
interpretation stability is low.
Label this:
Reactive Decision Zone
IM7 Read
The market becomes most emotionally persuasive precisely when the trader's decision process needs to become more selective.
Key Takeaway
Higher volatility should increase the threshold for certainty, not lower it.
Disclaimer
This framework is conceptual. It does not represent measured volatility thresholds, behavioral probabilities, or a trading signal.
Stage 1 — Candle
A new candle forms.
↓
Stage 2 — Attention
The newest candle receives disproportionate attention because it is visually dominant and immediately available.
↓
Stage 3 — Interpretation
The trader labels it:
"Recovery."
"Breakdown."
"Confirmation."
"Failure."
↓
Stage 4 — Emotion
The interpretation produces:
- relief,
- fear,
- urgency,
- confidence,
- regret,
- or FOMO.
↓
Stage 5 — Conviction
Emotion increases confidence in the interpretation.
↓
Stage 6 — Action Pressure
The trader feels pressure to:
- enter,
- exit,
- reverse,
- add exposure,
- move risk,
- or chase.
↓
Stage 7 — New Candle
A new candle appears.
If the framework is weak, the sequence restarts from zero.
Interrupt Question
Before acting, ask:
"Did the structure change, or did my emotional response change?"
That single distinction can expose the influence of recency bias.
Price is currently trading above the visible 9 EMA near $77,263.
That information is real.
The behavioral problem arises when technical observations become automatically transformed into certainty.
A trader already looking for recovery might think:
"Price bounced."
"The candle is green."
"The EMA was reclaimed."
"The low held."
"Everything is lining up."
Perhaps.
But a disciplined process asks whether those observations are independent.
The EMA reclaim and the green candle may both be consequences of the same short-term recovery.
The bounce and the movement above the EMA may not constitute separate structural events.
The goal is not to ignore technical evidence.
The goal is to avoid counting one move four times.
Not every change in opinion is bias.
Markets change.
Good traders should change with them.
The distinction is the trigger for the update.
Structural updating occurs when evidence changes the thesis.
Reactive updating occurs when emotional salience changes conviction.
The difference can be subtle.
That is why a diagnostic model is useful.
Use a three-column comparison.
Structural Update
Primary Question
"What materially changed?"
Attention
Broader evidence.
Trigger
Meaningful structural development.
Time Horizon
Consistent with the original thesis.
Emotional Pressure
Acknowledged but secondary.
Response
Adjusts conviction proportionally.
Goal
Accuracy.
Reactive Update
Primary Question
"What did the last candle do?"
Attention
Newest information.
Trigger
Visual or emotional intensity.
Time Horizon
Shrinks toward the latest candle.
Emotional Pressure
High.
Response
Conviction changes sharply.
Goal
Immediate certainty.
Recency Dominance
Primary Question
"Is this finally the move?"
Attention
Whatever happened most recently.
Trigger
Repeated volatility plus fatigue.
Time Horizon
Continuously resets.
Emotional Pressure
Very high.
Response
Bullish → bearish → bullish.
Goal
Escape uncertainty.
Diagnostic Question
Ask:
"Am I incorporating new evidence, or allowing new evidence to erase everything that came before it?"
That question separates legitimate adaptation from recency-driven narrative replacement.
One of the most uncomfortable market conclusions is:
The structure remains unresolved.
That answer does not generate much excitement.
There is no heroic prediction.
No dramatic directional call.
No immediate psychological closure.
But unresolved structure is still information.
The market does not owe traders certainty simply because they have watched long enough.
A trader can observe:
- a large rally,
- a sharp decline,
- a significant bounce,
- and another recovery attempt,
without being required to declare the next major direction.
Sometimes the disciplined conclusion is not:
bullish
or
bearish.
It is:
"My confidence should remain limited until the structure earns more certainty."
A disciplined operator does not ignore the current bounce.
They also do not automatically promote it into proof of recovery.
They separate three questions.
1. What happened?
Bitcoin expanded toward approximately $78,750, retraced sharply, reacted from the lower region, and recovered toward $77,500.
2. What has materially changed?
That requires evaluation of the current structure rather than the emotional force of one candle.
3. How much did my conviction change relative to the evidence?
This is the behavioral question.
If conviction moved dramatically while structural evidence changed only modestly, recency influence should be considered.
A professional process is not emotionally motionless.
It is proportionate.
New evidence should change the thesis by the amount that the evidence deserves.
Not by the amount that the candle feels important.
1. Identify the Previous Thesis
Before studying the newest candle, write:
"Before this candle appeared, what did I believe and why?"
This prevents the newest information from silently rewriting the analytical baseline.
2. Identify What Actually Changed
Ask:
"What new information did this candle provide?"
Be specific.
Examples might include:
- a meaningful level reclaimed,
- a level rejected,
- continuation,
- invalidation,
- volatility expansion,
- or nothing structurally decisive.
Avoid:
"It looks bullish."
That is an interpretation.
Identify the evidence first.
3. Separate Candle Size From Information Quality
Ask:
"Would I interpret this move the same way if the candle were visually smaller?"
If not, visual salience may be influencing conviction.
4. Check for Confirmation Stacking
List each piece of evidence.
Then ask:
"Are these truly independent observations, or several descriptions of the same move?"
Do not multiply confidence by counting the same event repeatedly.
5. Compare Conviction Before and After
Score conviction qualitatively:
Low / Moderate / High
Then ask:
"Did the evidence change enough to justify that shift?"
If conviction jumped from low to high because of one candle while the broader structure remains unresolved, reduce confidence.
6. Expand the Time Horizon
Zoom out mentally before acting.
Ask:
"Does this candle look equally decisive when viewed as part of the entire week's sequence?"
Recency bias becomes stronger when attention becomes narrower.
Context restores proportion.
7. Define What Would Actually Confirm the Thesis
Do not allow confirmation to remain vague.
Specify:
- what level matters,
- what continuation matters,
- what failure matters,
- what invalidates the view,
- and what evidence would require reassessment.
Then the next candle can be evaluated against a framework instead of an emotion.
Recency bias can distort risk because every new candle can make the trader believe the probability landscape changed dramatically.
That can lead to:
- chasing a large green candle,
- panic-exiting after a large red candle,
- reversing positions repeatedly,
- widening stops after renewed confidence,
- tightening stops emotionally after fear,
- adding exposure because recovery suddenly feels obvious,
- or abandoning a valid plan because the latest bar feels threatening.
None of those actions is automatically irrational.
Each may exist within a legitimate strategy.
The warning appears when the justification changes from:
"My predefined process calls for this."
to:
"Look at that candle."
The candle is information.
It is not a risk-management plan.
The current recovery does not automatically prove:
- that the recent low is permanent,
- that the correction has finished,
- that Bitcoin must return to the recent high,
- that the bullish trend has fully resumed,
- that another red candle cannot erase the move,
- or that short-term resistance will be broken.
Likewise, the prior decline does not automatically prove:
- that the broader bullish thesis has failed,
- that Bitcoin must continue lower,
- that the current bounce is false,
- or that bearish exposure is necessarily correct.
The disciplined conclusion is narrower:
The bounce is new information. Its importance must still be evaluated.
Recency bias should not become an accusation whenever someone responds to new information.
Changing a thesis can be completely rational when:
- structure materially changes,
- invalidation occurs,
- new evidence significantly alters probabilities,
- risk changes,
- or predefined conditions are triggered.
The behavioral problem is not:
"My opinion changed after a candle."
The behavioral problem is:
"My entire conviction changed because the newest candle felt more important than the broader evidence."
That is a much higher standard.
Recency effects are broadly recognized in cognitive psychology: recently encountered information can receive disproportionate weight in memory and judgment.
Financial decision-making adds an additional complication because recent price movement is not merely remembered.
It affects:
- P&L,
- emotion,
- perceived opportunity,
- risk,
- and urgency.
That makes the newest information unusually difficult to evaluate neutrally.
IM7's application of the concept is therefore not:
"Ignore recent price action."
It is:
"Give recent price action the amount of authority its structural importance deserves."
"The newest candle is not automatically the most informative candle."
"When conviction changes faster than structure, inspect the conviction."
"Volatile markets don't create confusion. They reveal it."
Volatility creates a strange psychological effect.
The more uncertain the market becomes, the more aggressively traders search for certainty.
Every large candle becomes a candidate.
The green candle says:
recovery.
The red candle says:
failure.
The next green candle says:
confirmation.
But the market may not have become clearer at all.
Only the latest interpretation became louder.
That is why disciplined analysis requires a separation between:
what changed
and
what felt different.
A candle can be dramatic without being decisive.
A bounce can be real without proving recovery.
A decline can be real without proving collapse.
And uncertainty can remain uncertainty even after a very large candle.
The trader does not need to predict every transition.
The trader needs a process strong enough to survive them.
Do not let the newest candle inherit authority it has not earned.
Before changing the thesis, ask:
What did this candle actually change?
Then ask:
Did market structure change as much as my conviction changed?
Then:
Am I integrating new evidence, or replacing the entire story with whatever happened most recently?
And finally:
What evidence would make this interpretation wrong?
If the answer to the thesis is still primarily:
"Because look at that candle,"
then conviction may be moving faster than structure.
Zoom out.
>
Reassess the evidence.
>
Do not confuse immediacy with importance.
Volatile markets don't create confusion. They reveal it.
How did this land?
What emotion or bias did this article help you recognize?
References
- [1]Bennet B. Murdock Jr. (1962). The Serial Position Effect of Free Recall. Journal of Experimental Psychology. DOI: 10.1037/h0045106.
- [2]TradingView (2026). Bitcoin / U.S. Dollar — BTCUSD 2-Hour Chart. TradingView. https://www.tradingview.com/chart/?symbol=BITSTAMP%3ABTCUSD
Pass the signal forward.
IM7 Intelligence studies financial markets through the lens of psychology rather than prediction. Our research focuses on behavioral finance, crowd psychology, sentiment, and decision-making to help readers understand why markets move—not just where they move.
IM7 Intelligence publishes educational research on market psychology, behavioral finance, and investor behavior. Nothing published by IM7 Intelligence constitutes financial, investment, tax, or legal advice. Always conduct your own research before making financial decisions.
Read the market's emotion before it acts.
Where this article sits in the map.
- Confirmation BiasYou are here
- Behavioral Finance
- Risk Management
- Fear
Curated paths, not random articles.
Behavior read in real time.

Ismael Mercius
Ismael Mercius is the founder of IM7 Intelligence, where he writes about crypto market psychology, behavioral finance, and the sentiment cycles that drive digital asset prices. His work focuses on how traders actually make decisions — and the recurring errors that show up in their P&L.
- Crypto market psychology
- Behavioral finance
- Market sentiment analysis
- Trader behavior & decision-making