What makes a chart behavioral
A behavioral chart pairs data with an explicit read of participant psychology. It answers: who is long, who is short, what are they feeling, and what does the tape suggest they are about to do?
A Behavioral Chart is not a price chart with lines drawn on it. It is a visualization of what participants are doing — positioning, funding, flows, sentiment — annotated to show where the crowd is trapped, exhausted, or misreading its own conviction.
A behavioral chart pairs data with an explicit read of participant psychology. It answers: who is long, who is short, what are they feeling, and what does the tape suggest they are about to do?
Every chart carries a title, a source, and an educational note. IM7 charts are read alongside articles; they are not stand-alone predictions and they never contain a price target.
Study the recurring shapes — funding resets, positioning capitulation, sentiment divergence — until they become part of your vocabulary. The archive is designed to build pattern recognition, not to be a signal service.

Bitcoin repeatedly defended $78K until traders began treating support as inevitable. When oil approached $100 and macro pressure intensified, that confidence became vulnerable—revealing how repetition creates false certainty before structure actually confirms it.

Nearly $1 billion in recent Bitcoin ETF inflows did not prevent a sharp $2,000 decline. The behavioral trap is the Institutional Safety Illusion: visible institutional demand can make downside feel more protected than the evidence justifies.

Bitcoin went from “breakout confirmed” above $81K to “breakout failed” near $79K in less than a day. The deeper behavioral signal is how quickly one jobs report and one large red candle overrode the market thesis traders had just formed.

Bitcoin surged from the upper-$79K area toward $81.9K, and traders who felt uneasy near $76K now feel increasingly comfortable buying higher. The behavioral trap is Price-Induced Safety: rising price can reduce perceived risk even when actual market risk has not fallen.
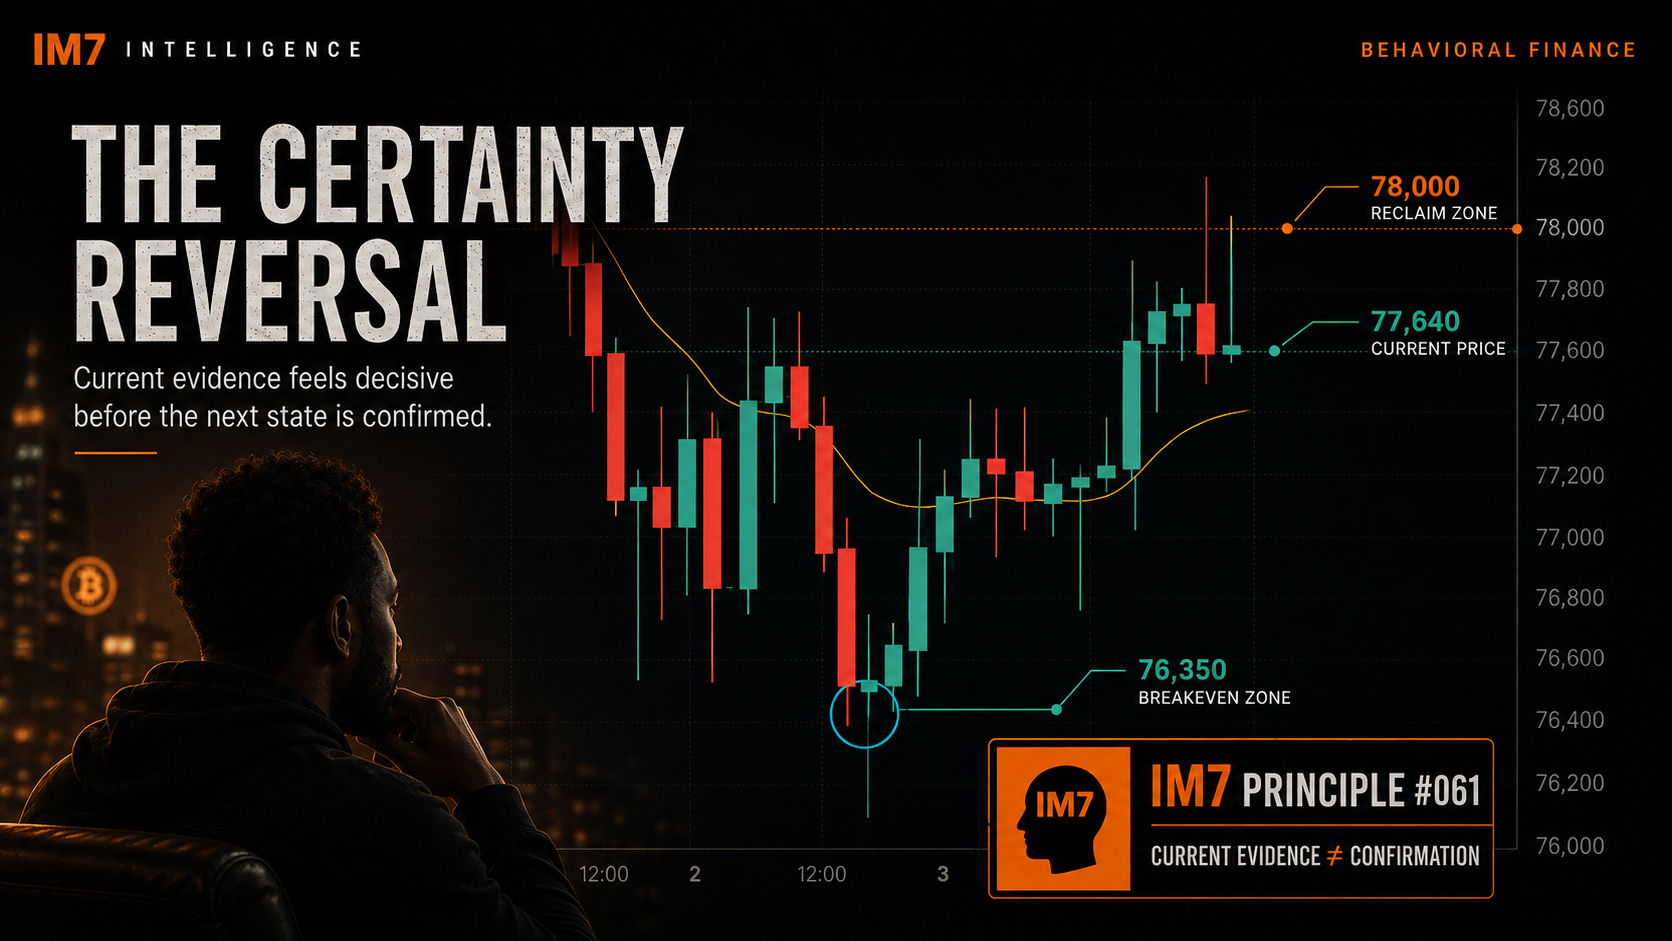
Bitcoin bounced from roughly $76.35K toward $77.64K after yesterday’s breakdown. The bigger behavioral risk is how quickly traders convert each new move into certainty about what comes next.
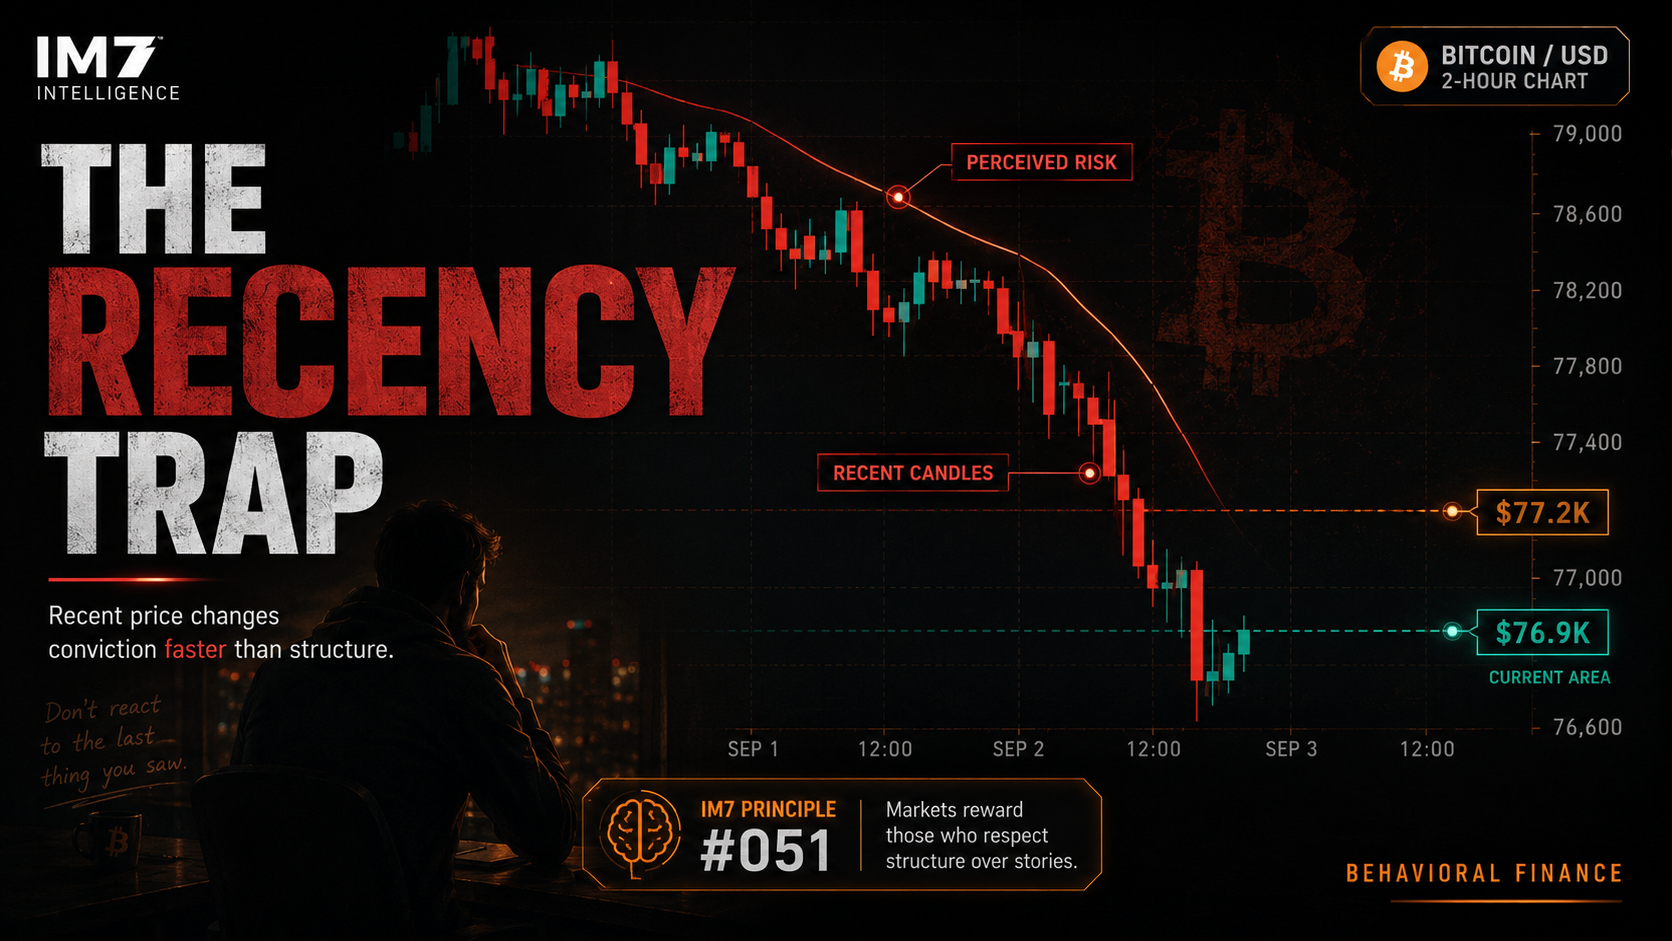
Bitcoin fell from the upper-$78K range toward $76.9K, and trader perception shifted with it. IM7 examines the Bitcoin Recency Loop: how recent candles change perceived risk faster than market structure actually changes.
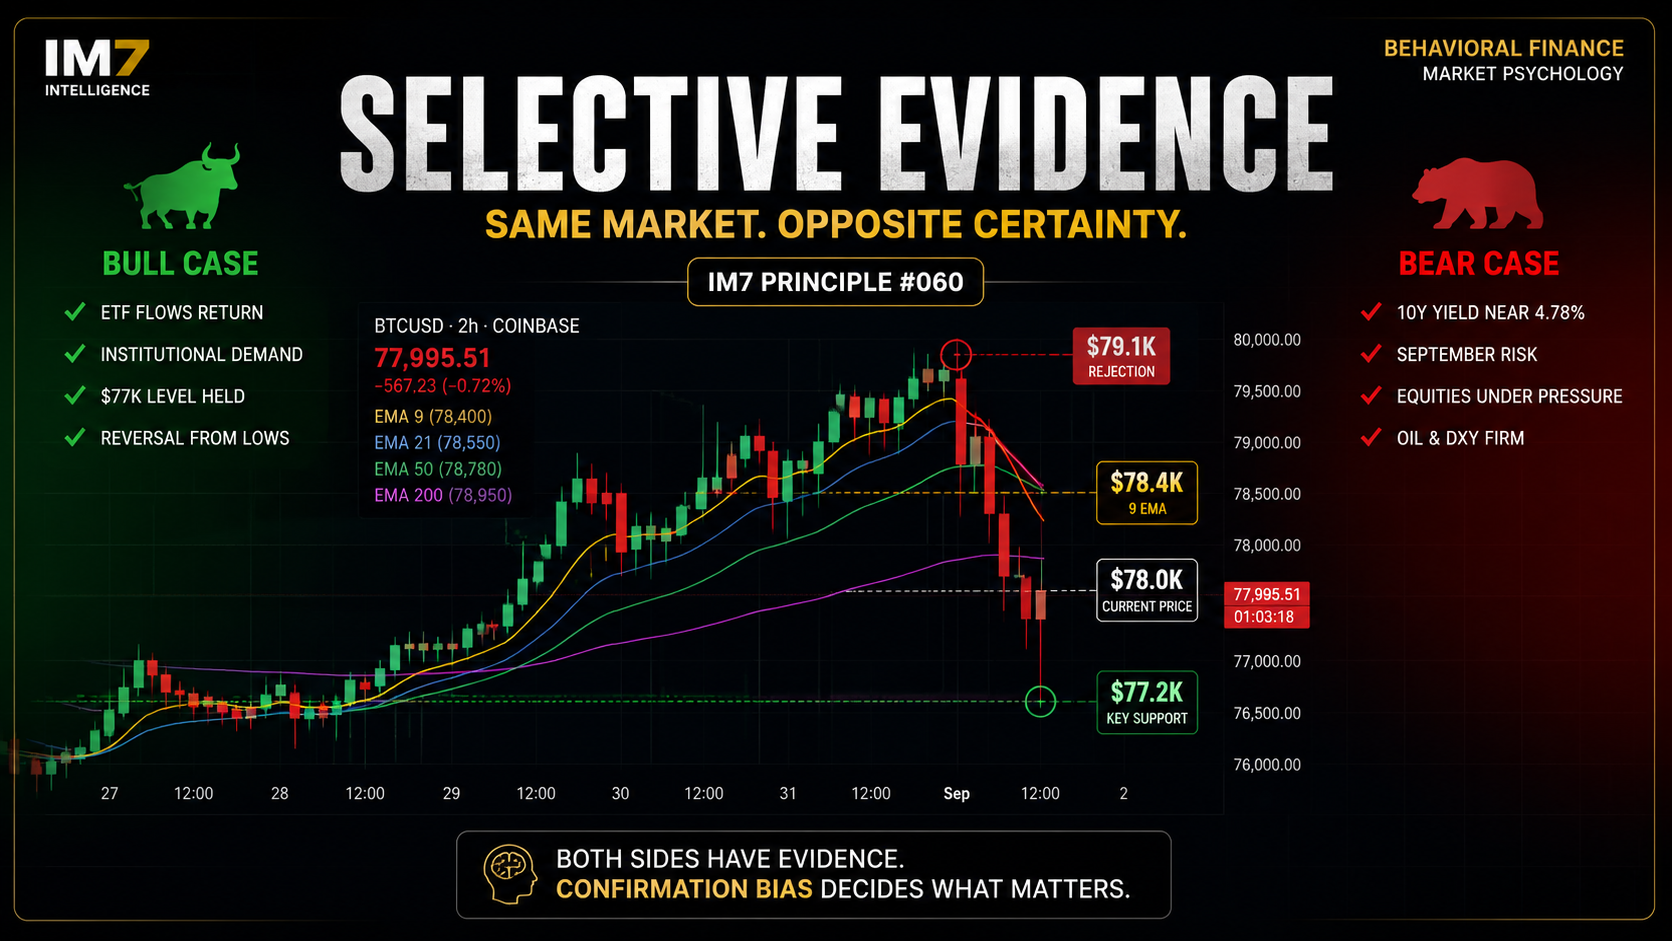
Bitcoin is caught between bullish ETF demand and a worsening macro backdrop. The bigger behavioral risk is not choosing the wrong side — it is selectively using evidence to defend the side you already believe.
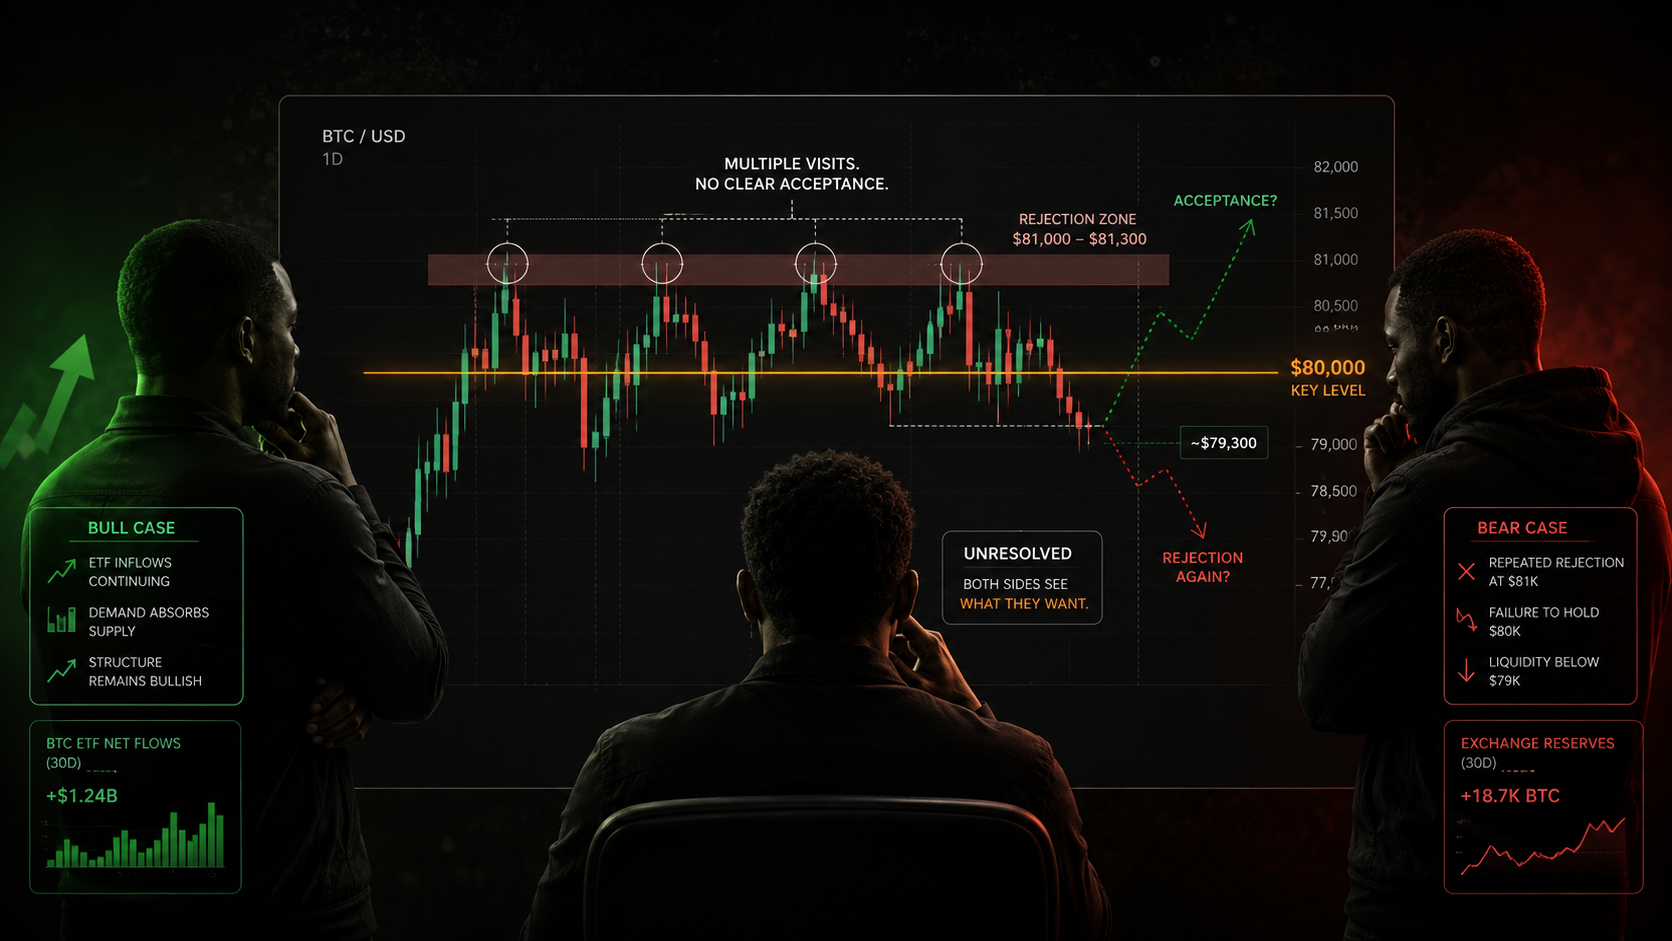
Bitcoin rejected near $81K again while ETF inflows remained strong, giving bulls and bears legitimate evidence for opposite conclusions. IM7 examines how confirmation bias turns an unresolved market into two completely different realities.
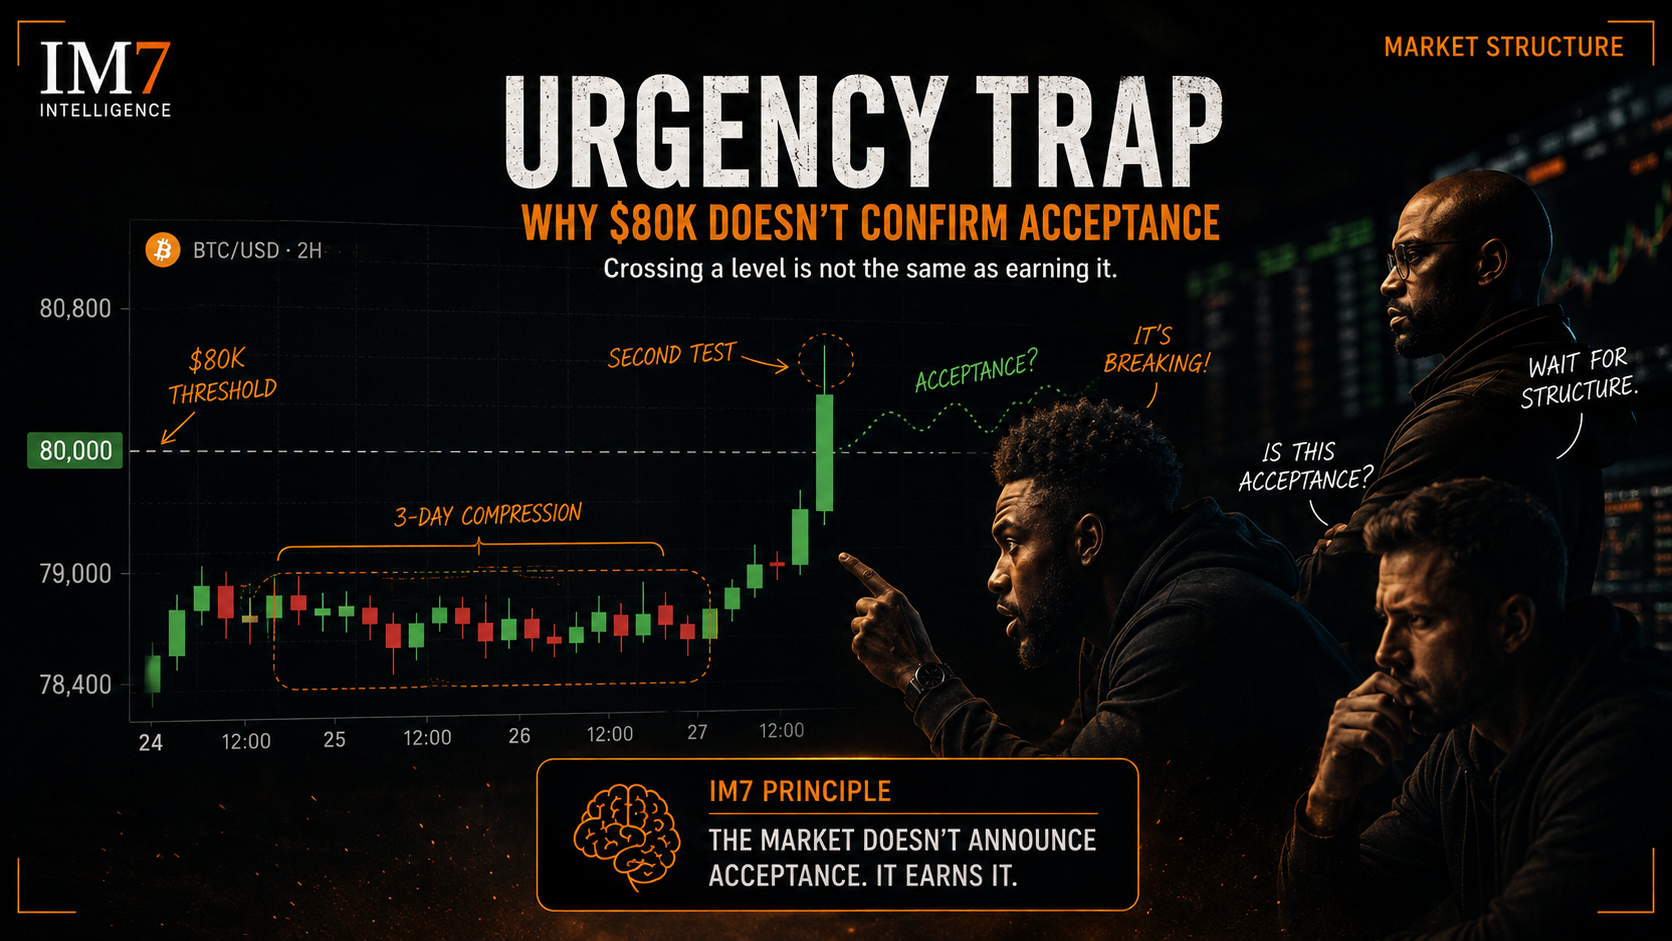
Bitcoin pushed back through $80,000 after days of compression, but the behavioral risk is shifting from impatience to urgency. IM7 examines why crossing a level is not the same as establishing acceptance above it.
The academic tradition behind IM7 — from Kahneman and Thaler to the biases that quietly govern every crypto cycle.
How fear, greed, and herd behavior shape every Bitcoin cycle. The pillar page for market psychology.
The full IM7 framework for reading Bitcoin sentiment — indicators, tape, positioning, and behavior.
The working vocabulary of behavioral finance — Anchoring, Loss Aversion, Confirmation Bias, and more.
One clear behavioral read before the open — regime, sentiment, liquidity, signal.
Long-form autopsies of specific cycles, crashes, and euphoria phases studied through the IM7 framework.